# 라이브러리 불러오기
import folium

# 서울 지도 만들기
seoul_map = folium.Map(location = [37.55, 126.98], zoom_start = 12)

# 파일로 저장
seoul_map.save('./seoul_map.html')

# 서울 지도 만들기 - 스타일 적용
seoul_map = folium.Map(location = [37.55, 126.98], zoom_start = 12,
                       tiles = 'Stamen Toner')

# 파일로 저장
seoul_map.save('./seoul_map.html')

import pandas as pd

# 데이터 불러오기
df = pd.read_excel('/content/drive/MyDrive/hana1/data/서울지역 대학교 위치.xlsx',
                   engine = 'openpyxl')

 df = df.set_index('Unnamed: 0') # 인덱스 설정
# 서울 지도 만들기 - 기본 마커
seoul_map = folium.Map(location = [37.55, 126.98], zoom_start = 12,
tiles = 'Stamen Terrain')
# 마커 표시
for name, lat, lng in zip(df.index, df.위도, df.경도):
folium.Marker([lat,lng], popup = name).add_to(seoul_map)
# 파일로 저장
seoul_map.save('./seoul_univ.html')
# 단계 구분도
import pandas as pd
df = pd.read_excel('/content/drive/MyDrive/hana1/data/경기도인구데이터.xlsx',
                   index_col = '구분', engine = 'openpyxl')

import json
bnd = json.load(open('/content/drive/MyDrive/hana1/data/경기도행정구역경계.json',
                encoding = 'utf-8'))

# 열 이름 데이터 타입을 문자열로 변환
df.columns = df.columns.map(str)
# 경기도 지도 만들기
ggd_map = folium.Map(location = [37.55, 126.98], zoom_start = 9,
tiles = 'Stamen Terrain')
# 단계 구분도 - 2007년
year = "2007"
folium.Choropleth(geo_data = bnd, # 지도 데이터 = 경기도 경계선
data = df[year], # 인구 데이터 = 색깔로 표현할 값
columns = [df.index, df[year]], # 지역의 이름, 해당 연도 인구
fill_color = 'Reds', # ColorBrewer code
fill_opacity = 0.3, # 다각형 내부 색상 투명도
line_opacity = 0.5, # 선 투명도
# 지도 데이터와 인구 데이터를 연결하는 내용 = 지역 이름
# 원래 features 이지만, 공식 문서 문법 표기상 feature 사용
key_on = 'feature.properties.name').add_to(ggd_map)
# 파일로 저장
ggd_map.save('./ggd_' + year + '.html')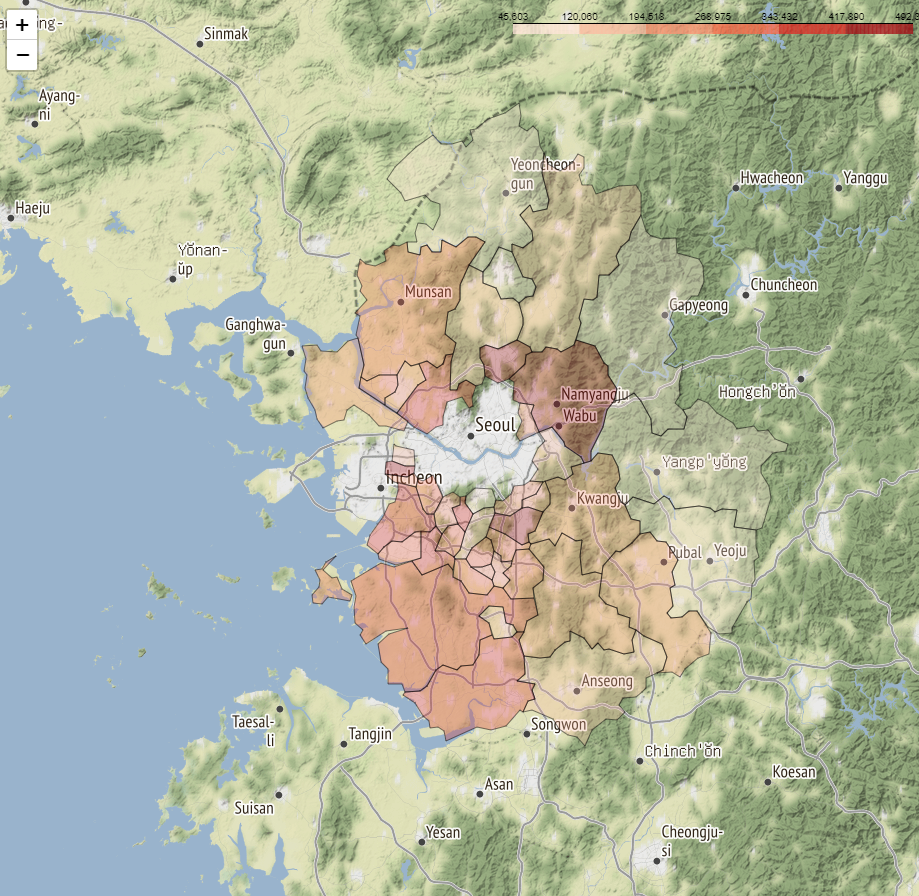
# 경기도 지도 만들기
ggd_map = folium.Map(location = [37.55, 126.98], zoom_start = 9,
                       tiles = 'Stamen Terrain')

# 단계 구분도 - 2017년
year = "2017"
folium.Choropleth(geo_data = bnd, data = df[year],
                  columns = [df.index, df[year]],
                  fill_color = 'Reds', # ColorBrewer code
                  fill_opacity = 0.3,
                  line_opacity = 0.5,
                  key_on = 'feature.properties.name').add_to(ggd_map)

# 파일로 저장
ggd_map.save('./ggd_' + year + '.html')

'Python > [시각화]' 카테고리의 다른 글
| [seaborn] 시각화(산점도, 히스토그램, 히트맵, 비율 막대 그래프, 빈도 막대 그래프, 상자 그림, 바이올린 그림, 조인트 그림, 그리드 분할, pairplot) (0) | 2023.06.18 |
|---|---|
| [matplotlib] 그래프 시각화(보조축, 2축 그래프, 히스토그램, 산점도) (1) | 2023.06.18 |
| [matplotlib] 그래프 시각화 2(선 그래프, 면적 그래프, 막대 그래프, 옵션 지정) (1) | 2023.06.18 |
| [matplitlib] 그래프 시각화 (0) | 2023.06.16 |